This page is intended to give a quick demonstration of the interface and provide a starting point for new users. Concepts will be briefly discussed whilst running through an example session in which we will read, manipulate, display, and print some ISIS data. For a full description of the interface please consult the Overview page.
Before anything useful can be achieved, data of some kind must be loaded into memory from a file within Genie. Data is stored in sets, with every reading operation resulting in a new set being created. For a description of sets see Important Concepts.
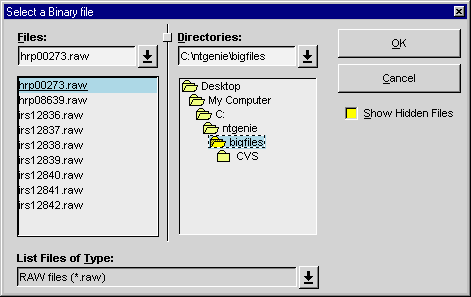
We will now read the first spectra from an ISIS RAW file into Set 1. Select "Read", and then "Binary" from the "File" menu.

Navigate to the bigfiles directory which should be just under the main genie directory, and select the first file in the list, hrp00273.raw.

After selecting the file and clicking "Ok", you will be prompted for the block numbers you want to read. As we only want the first spectra (or block), ignore the "TO:" field and click "Ok" again to create a new set containing spectra one from hrp00273.raw.
Now repeat the procedure to place the 5th spectra from the same file in Set 2. Notice that the current set increments with each read (it is shown at the bottom of the main window).
For more information on reading data see Reading Data Files.
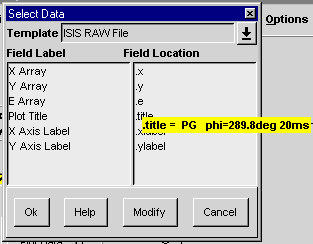
Before we can use the two new sets we have created they must be associated with templates. Fortunately as ISIS RAW files are a recognised format this has already been done for us. To see the template associated with Set 2 (the current set), choose "select data" from the select menu or click the "Browse!" button.

See Working with Templates for a description of this.
Before or after displaying data, you may wish to carry out some standard Open Genie operations, such as set arithmetic, unit conversion, and rebinning. Each operation results in the creation of a new set, leaving the original data unchanged. These can all be carried out via the Operations menu.
For example, to add the two sets we have loaded together. Select Operations, Arithmetic from the main menu.

Form the expression shown above, by selecting the two sets and operation required, and then clicking "Ok". see Set Arithmetic for more details.
Before going on to display some data lets recap on what sets we now have at our disposal. These can be used by chooseing Select Set from the Select menu.

Notice the first two sets we read from hrp00273.raw and the new set we created by adding the first two sets. Make set 1 the current set by selecting it and clicking "Ok"
Clicking the "Plot Data" button produces a histogram or line graph depending on the data format. Other type of plot are available via the Draw menu.
Click this button now and a histogram of the first set will appear in the plot window. Now select the third set using Select Set again. To plot this set on top of the first, deselect "Clear before Plot" and click "Plot Data" again.
To distinguish between the two sets it would be a good idea to make one a different colour, so click on any part of the graph with the mouse selection button (see Plot Area Interactions for further details).

You can now change the colour and click "Ok", which should leave you with something resembling this:

Now that we have created our masterpiece and no doubt made some great scientific discovery in the process, it would be a shame to loose these results.
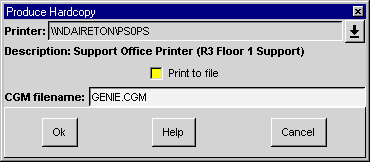
The current picture can be saved (in CGM or postscript format) or printed by clicking the "Hardcopy" button or selecting Print from the File menu.

Choose your printer or select "Print to file" to create a CGM file which could later be imported into another package, e.g. Word as part of a report, or PowerPoint for a presentation. See Generating a Hardcopy for a more detailed description.
Data sets can also be saved in Open Genie, ASCII, or NEXUS format. See Writing Data Files for details.